All posts by Senthilraj


Deprecated: Function get_magic_quotes_gpc() is deprecated in /home1/microoat/public_html/blog/wp-includes/formatting.php on line 3964

Deprecated: Function get_magic_quotes_gpc() is deprecated in /home1/microoat/public_html/blog/wp-includes/formatting.php on line 3964

About Senthilraj

DW BI Architect and BI Project Management (Specialized in MicroStrategy). Hobbies/Passion about photography, tennis, music, travel-trekking. Website: www.b-diamonds.com www.facebook.com/SENRAJ81 www.linkedin.com/in/senraj

Automatic Column Recognition in MicroStrategy 9

Architect 9.x can automatically create attributes and facts in order to save time during the schema creation process. The facts and attributes are created based on data types, database column names, primary and foreign keys, and other schema creation heuristics. The user can define how attributes and facts are created when tables are added to the project by defining the automatic column recognition rules available in the MicroStrategy Architect Settings menu, by following the steps.

  1. Open the Setting menu, located under Options.
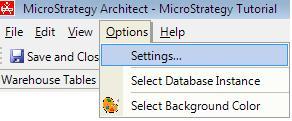
    Step 1
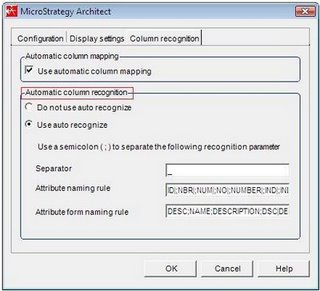
  2. Go to the Column Recognition tab.
    Step 2
  3. Do not use auto recognize option is used to disable the automatic creation of attributes and facts when tables are added to the project using Architect. Uncheck this radio button.
  4. Use auto recognize option is used to enable the automatic creation of attributes and facts when tables are added to the project using Architect. These are created based on the following schema creation heuristics and rules:
    • Separator: The character used as a separator in the database column names. For instance, a database column name such as USER_ID uses the undersocre character (_) as a separator.
    • Attribute naming rule: Database column name suffixes that identify that the columns should be mapped to a new attribute as the identity form. A semicolon (;) can be used to separate suffixes that are to be mapped to new attributes. It is also possible to define how the attribute name is created by using a vertical bar () to define what the suffix is replaced with in the resulting attribute name.
    • Attribute form naming rule: Database column name suffixes that identify that the columns should be mapped to a new attribute form.
  5. In addition to using these rules to define attributes and attribute forms, selecting the Use auto recognize option also employs other schema creation heuristics:
    • The automatic column mapping rules described in Automatically column recognition are employed to map columns to existing attribute forms that use the columns in their definitions.
    • An attribute is created for any column defined as a primary or foreign key, and the column name for the primary key is used to define the attribute name. The column name for the primary key is used to define the attribute name even if the primary key column is not included in the project.
    • Every column must be mapped to either a fact or an attribute. If none of the schema creation heuristics or the rules you define can determine whether to create a fact or attribute for the column, an attribute is created for the column.
  6. Even when the option to not use auto recognize is selected, it is still possible to take advantage of the auto recognize feature on a table on table basis. Right click on the table in the Architect Project Tables View. Select Recognize > Attributes, Facts, or Both.
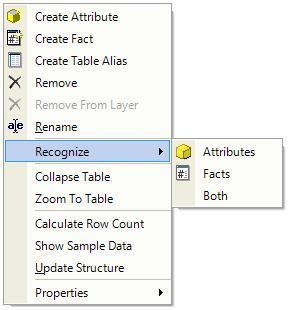
    Additional Step

MicroStrategy 9 GA Features

Dashboard Features:
 Easy to add Tabs and report layouts(Panels)
 Default templates available to choose the number of reports per tab
 Tab adding is just clicking plus sign(+)
Drilling is possible in AJAX or DHTML mode
 All, Total features are introduced and bugs are fixed
 Many graph issues in 8 are fixed in 9

Prompt & Filter
Prompt and Filter can be created in WEB
 New web options for prompt values display, Search in list view, drop down box and many new web options for filter and prompt
Total, Sub Total
 Advanced totaling, Display options (What ever available in Desktop, same features are now available in WEB

Derived Elements
 After report execution; kind of consolidation and partial custom group is possible (but actual cons and cus grp) and derived element can be saved and reuse the same.
 Example: Jan+feb or making Jan& Feb row together as ‘Winter’ and or total of MAR+APR
Threshold
 Threshold is possible in WEB on the fly. It’s just slider bar…you can set many thresholds with different color just on the fly.

Document Report
 Reports can be placed parallel in document report

Back & Forward button
 In MSTR-8, if you click on IE back button, session will be expired. But in MSTR-9, inside the MSTR-9 web there is option for back & forward.
 Suppose you applied some total, formatting, formula on the fly and if like to switch to old one, you can just click on back button

Preferences, Notes, Screens
 Extra preference like web colors, etc
 Different screen in MSTR 8, like menus and icons
 Folders/objects can be viewed in tree view (expand like windows explorer)

Delivery Service in WEB (new feature like Narrowcast server):
 It looks in the upcoming MSTR version, Narrowcast component won’t be there
 Delivery service: you can subscribe reports for email or folder, or you email reports directly.
 You add many email IDs, subscription
 Everything in WEB
Note: you cannot import LDAP or SMTP server emails from server, its has been raised as enhancement request, may be in 9.x we can expect.
Note: Dynamic subscription not possible in delivery service, next version may have (Not sure)

CUBE (New very big feature)
 Cube is kind of Cognos Cube. You can pull many attributes and metrics into metrics as cube report. And when you link other normal reports with cube report, it will fetch data from cube report.
 Cube report can scheduled
 Cube object deleted, reports linked to cube report won’t work.
 There cube at user level, grp level and many things are there…you can find more details in website or help in MSTR-9.

CUBE Advisor: (Another big feature)
 If I have to say in one line: it will advise you to make how many reports can be converted to cube link report

Admin:
 Many new features in MSTR 9 Admin
Special one: Users, Grps, Sec.Filters can be created in WEB under Admin login.

Architect: (New component in MSTR DESKTOP)
 Like BO, OBIEE tools here you can make table level relationships.
 No need to add key attributes as a child/parent.
 Its good component, this is what we were looking from MSTR.
 Still doing many testing, investigation on some of the scenarios, so will post more once I complete the analysis.

Multiple Sources:
 Multiple source can used, differentiae the tables with colors……
Metric name can be removed (no more “Metric” name in reports)

Other features;
 New data types (like NCHAR, Binary data type)
 New SQL tuning properties
 New OLAP functions
 New forecasting functions
 Temp table indexing
 Data mining functions
 Linking websites in dashboard
 Banding
 Portlet to portlet (web linking feature)
 Multi select rows, columns on the fly and do manipulations.
 Watermark in documents, reports background
 Linking report from dashboard
 Personalized Prompt Answers
 Metadata and Data can be in same DB
 Importing delivery service from NCAST to Delivery service
 64 bit-Windows supported
 64 bit web server supported
 Command manager, Object manager, Project merge, desktop license are separate now.
 Eclipse can be linked to WEB files and easy to customize the MSTR WEB 9
 Now Caching can be done at EXCEL, WORD,XML, HTML CSV format (means when you export report it can be cached at excel level)

AND many more new features……will post when ever come across……

MicroStrategy Jobs

Join and Post only MicroStrategy Jobs related news, openings in this group

microstrategyjobs@googlegroups.com

Complex graph in Dashboard creation in WEB

Complex graph like ‘combination: Dual Axis – Bar – line’ graph cannot be created in Dashboard in WEB.

To achieve the same, create a report in desktop and make as above mentioned graph and save.

In WEB, while creating dashboard, add this data set in dashboard by ‘right click’ data set and add with formatting option. Now the graph which cannot be done in web, can be done in this way.

MicroStrategy 8.0.x Support Expiration

Support for MicroStrategy 8.0.x officially expires on April 2, 2009.
According to MicroStrategy, Inc: If you are still running this version, upgrade planning and implementation services are available through MicroStrategy Consulting and can be requested through your Account Manager. If you are unable to get upgraded before the version expiration, please contact your Account Manager to determine your options for receiving continued support on the expired version.