All posts by Ronald Park

About Ronald Park

Ronald has been working on Information Systems projects for just over 15 years now. He started out building custom Client-Server solutions at Andersen Consulting and soon moved into the world of packaged ERP systems specializing in SAP R/3. For the last 8 years, Ronald has been focused on delivering enterprise business intelligence solutions via packages like MicroStrategy, Cognos, and SAP BI.

Narrowcasting Dashboards through email

Last year, our group was tasked with developing a MicroStrategy dashboard that was to show Daily, Weekly, and Monthly views of the business from 5 different perspectives.  The dashboard was to contain 30 reports each with about 3 to 15 rows of data and 10 columns.  The dashboard was to run nightly and needed to be e-mailed to about 75 executives.  This was THE report for the enterprise.   Every solution we came up with was developed all the way through and tested only to find out that there would be file size and report performance problems.  This article will describe each approach, and will finish with the selected solution.

Our initial approach was to attempt to provide the most pleasant user experience possible by building an interactive Flash dashboard.   For two weeks we worked through the dashboard development, layering panel after panel, placing report upon panels at various levels, and manually formatting each and every pixel.   The end product was both interactive and pleasing on the eyes.   We thought we were merely steps away from completion.   We then began testing our product by emailing the dashboard through Narrowcast.  We quickly noticed that the dashboard e-mail was 2 MB, and took about 10-15 seconds to load.   The size of the e-mail was a bit larger than we would have liked, and 10-15 seconds of wait time was unacceptable.  The solution was quickly dumped, and we started to look at our options.

Excel or PDF attachments are always a great option when narrowcasting reports, and the size of these documents are very efficient.   However, this dashboard was required to be viewed directly from the e-mail mainly because of the audience that it was built for.   Shown below are the options in Narrowcast for what can be included in the body of an e-mail.

fig31

Our next option was to use Report Service documents, and if that failed we would try out HTML document solutions.   Both options were tried, and although they did deliver the reports in an acceptable format, the file size of the dashboard was still between 1 and 2 MB.   The problem with load time had been solved, but the dashboard was still just a bit larger than desired.   (a Narrowcasted excel attachment of the reports only totalled 100kB)

It was at this time that we started working directly with the Narrowcast server document (the first option in the picture above).  What we found is that server documents are very easy to create.  Basically they involve inserting grid reports onto a blank template as show below:

fig32

The end result was a very nicely formatted dashboard/e-mail with a file size of around 800kB.

Although we could have lived with this result, we still felt there was room for improvement.   We knew from experience with other BI tools that similar e-mailed reports were coming through at half the size, so we wanted to investigate a little bit more.  What we found were 2 more settings that could be applied.   First off, under the Advanced Properties of each document object, there was a setting to ‘Improve performance by not preserving the grid reports formatting’, as shown below:
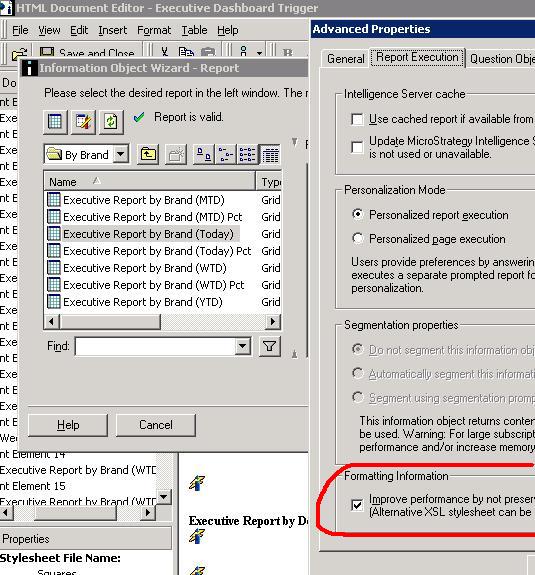
fig33b

Next from each report object’s Document Element Properties, there is a place to specify your own style sheet, which your Narrowcast server should have access to.   It is this setting that will give your report more formatting then just text.   See the picture below that shows we picked the stylesheet called ’Squares’.

fig34

With these changes, we were able to get the e-mail down to 400kB, and acceptable size, and even a bit better than we expected.   I realize this is alot of detailed technical information, but hopefully, this case study shows the various options of emailing with the Narrowcast server.  If the report does not need to be directly viewable in the e-mail’s body, then attachments are definitely the best way to go, but otherwise, I’m pretty sold on using Narrowast Server documents with style sheets.

Historical Master Data Attributes

Historical master data attributes are often specially handled when designing an Enterprise Data Warehouse (EDW).   On most BI projects I’ve been on, there is an exercise of sitting with the business in order to determine which attributes are required to be stored historically.  Once this is complete, the requirements are then sent off to the Data Warehouse team for design and development.  How this solution gets architected may be one of the determining factors on whether your project is successful or not, and as a BI team member, sometimes getting your two cents can make your life that much easier.

In the past, I’ve come across three different designs for handling historical master data attributes, with one of them standing out above the rest.    The first design involves placing historical attribute fields directly on to fact tables.  Please remember we are talking about historical attributes that are master data related, and not historical attributes that are related directly with transactions.  The major issue with this comes about during validation and warehouse maintenance if data problems exist.   In order to validate that ETL processes are working properly, one now has to validate every row in fact table to make sure that the  historical attribute is correctly derived.   Also, because this attibute is stored at the fact level, we now have to add this attribute to any new fact tables when needed.  If, for any reason, problems are found in the historical attribute derivation, then the fact tables have to be dropped and reloaded, then re-validated.  Simply put, this solution should not be used if it can be avoided.

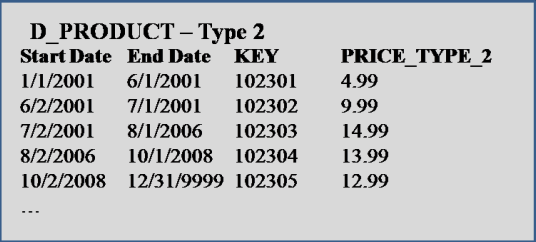
Another design which is quite popular is the use of time based, type 2 dimensions.  This solution involves storing attributes, along with the date range for which those values are valid.   So for example:

fig21a

This solution works just fine in conjunction with a fact table.  To pull the current value of an attributes, we only need to pull the latest record, usually marked with an end date of ‘12/31/9999′.   The only issues that come about with this approach is one, if you store more than one historic attribute on a dimension, then reporting history of those attributes without joining to a fact table cannot be accomplished.    From our example diagram above, notice that the Price Type field is accurately showing history, but Placement Type contains an extra record showing Aisle 5 starting on both 6/1/2001 and 7/1/2001.   One solution for avoiding this, is to store the Previous values for every historic attribute, and then only pull historic data for an attribute if the Prev value <> Current value.  The second issue often comes about when ETL is used to create history in the warehouse.   This may be the only possible solution, but allowing this can ’open up a can of worms’, and now makes validation a much more difficult process.

The recommended solution here actually involves setting rules to the type 2 dimension just discussed.   First off, only track the history of one historic attribute per dimension table.

fig21d

This simplifies the ETL and data storage designs, and also eliminates the confusion when you have more than one historical attribute on a table.    Storing the data in this way not only seems more natural, but also simplifies the validation and maintenance of the historical data.   If a problem is found, then quite simply, fix that problem in one place rather than dealing with more complex ETL procedure used to track multiple historic fields on one table.  Second, don’t use ETL to create history if it can be helped.   ETL created history only starts at the time that the ETL script is implemented, so you never get a full view of history unless it was implemented from the beginning.   Also, ETL created history is difficult to validate, and in the case that problems arise, fixing that history can also be a problem.   Of course, every implementation is different, and you may not have a choice.  All of the information in this article has been tested thoroughly through implementation via MicroStrategy 8.1.

The Snowflake Schema

The MicroStrategy platform is designed to run on a data warehouse architected using a snowflaked data model.  For those unfamiliar with this term, snowflaked schemas are similar to the star schema concept except that they are allowed to have additional dimension tables joining directly off of other dimensional tables.  When one looks at the dimensions sprouting off of one another,  one might compare the structure to that of an actual snowflake’s crystals.

 fig11

So are there any advantages of using a snowflaking over the straight star schema model?

First off, lookup tables are a simple way of immediately taking advantage of snowflaking.   Say you have a dimension table called D_PRODUCTS and a field called PRODUCT TYPE which has only 4 distinct values.  Let’s say you require a list of PRODUCT TYPE’s like when you are creating a drop down for a filter on a report.   Without snowflaking, MicroStrategy will be forced to do a “select distinct PRODUCT TYPE from D_PRODUCTS” in order to pull the distinct product type values to display to the user.  With snowflaking, we can instead create a table called V_LOOKUP_PRODUCT_TYPE that snowflakes off of D_PRODUCTS, and whenever we need to pull a product listing, we instead only need to query a “SELECT * from V_LOOKUP_PRODUCT_TYPE” which will only contain the 4 values we want to display.   Although the solution without snowflaking probably is not that bad, it is still more expensive than with snowflaking, but can be even more expensive if D_PRODUCTS contains a large amount of data.

Secondly, snowflaking allows for more logical and efficient ways of storing data into hierarchies.   Using a star schema model without snowflaking requires that all dimension tables be flattened out and joined directly to our fact table(s).   So, let’s say we have a hierarchy which consists of various manufacturers and the products that they manufacture.   Here is an example of what a model without snowflaking might look like. 

 fig12b

And, with snowflaking:

 fig12c

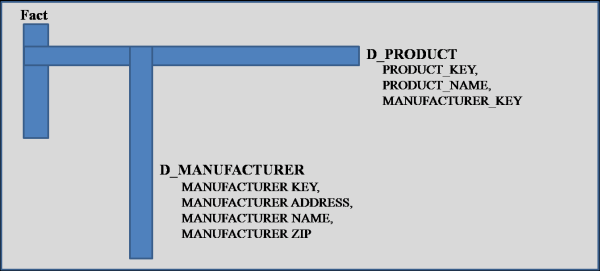
Notice that with snowflaking, we can now store manufacturers off as it’s own entity which can help organize data more logically.  Also, we reduce the size of D_PRODUCT, and only have to go to D_MANUFACTURER when we need to pull data about the manufacturer. 

Without snowflaking, we have two options for adding new attributes.  Either 1. add the attributes to existing dimension tables, or 2.  add new dimension tables and place the attributes there.  The first option eventually leads to unnecessarily long dimension tables which can be costly in terms of loading and query performance.   The second option might reduce the size of your dims, but also separates the dimension tables apart, so they can no longer be queried together unless joined to a fact table.   For example, if we split out D_PRODUCT and D_MANUFACTURER, each joined separately to our fact, then a report listing all products and their manufacturers, now must be queried by joining also to the fact table.    With a snowflaked schema, we can logically join dimension tables together to make up our hierarchies, and also limit the size of our dimensions, all without having to join to a fact table.  

I’m sure there are other advantages of using a snow flaked schema over the traditional star schema, such as the possibilities of simplifying ETL and EDW designs.   What are your thoughts on using the Snowflake Schema data model for analytics?