You know how, after you execute a report, every time you make a change to the Report Data Options the report gets re-executed in order to apply those changes?
Well, in version 9 (not sure about 9.01 yet) this doesn’t happen for the Metric Join Type and Attribute Join Type options. I don’t know if this is a bug or a feature, though the behaviour appears to be intended by the developers. If someone from MicroStrategy is reading this, please provide some background details.
The downside of this is, of course, that if you are debugging a report by modifying one of those options, you might get the idea that your change had no effect whatsoever. This is because you were used with automatic re-execution after you pressed OK, as in the previous versions.
All posts by Sorin Suciu
Deprecated: Function get_magic_quotes_gpc() is deprecated in /home1/microoat/public_html/blog/wp-includes/formatting.php on line 3964
Deprecated: Function get_magic_quotes_gpc() is deprecated in /home1/microoat/public_html/blog/wp-includes/formatting.php on line 3964
Microcharts as Tree View Selector
Apparently this functionality has been there for quite a while, but I only chanced upon it recently.
Microcharts are not only an awesome way of displaying tons of data in a meaningful way, but they can also be used as a tree view selector. Try to imagine how would it be to use a combination of drop down selectors (each in its own panel, with complex targeting), and you will see why the tree view is so much better.
Here is how to do it:
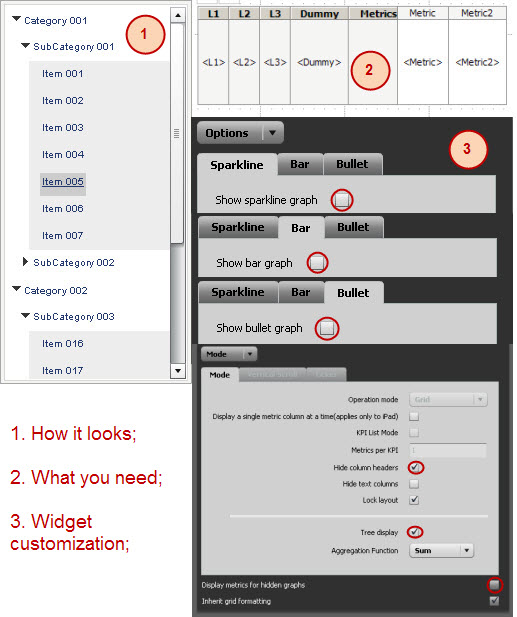
The tree view can have up to three levels, which means you can have a total of three attributes before the dummy one. You need a dummy attribute (can be Year, or whatever) and a couple of dummy metrics, in order to have the widget render.
You also have to use one of the attributes (preferably the lowest grain) as a selector for other panels.
Have fun with it!
Sorin
Metadata Browser Source Code
Good news everyone 
As I no longer have time to work on Metadata Browser’s development, I decided to do what I should have done a long time ago – publish the source code!
Have fun with it, and don’t forget to make your updates available to the community 😉
The code is written in VB6.
I will ask you in advance to apologize me for any ugly spaghetti code that you might find. Please bear in mind that I had no knowledge of VB6 when I started working on this tool, a few years ago.
Best regards,
Sorin Suciu

This work is licensed under a Creative Commons Attribution-NonCommercial-ShareAlike 3.0 Unported License.
Custom Visualizations Training
Good news everyone!
MicroStrategy is planning to introduce Custom Visualizations into their training agenda, so if you are into widgets and other dashboard visualization tuning this is certainly something worth looking forward to.
Metadata Browser v3.01
As promised earlier this year, Senthil Raj – author of the celebrated Object Tracking Tool, has kindly agreed to merge his application with Metadata Browser.
After much coding and testing, time has come to unveil this brand new application, which you will surely find very useful. Click here to download it.
You can also download the manual here.
So, what’s new?
- Well, there’s obviously the new and more powerful than ever Object Tracker. You can use it both to extract a simple list of objects in your project, and to generate documentation such as format, alias, formula, dimensionality, transformation and condition for metrics; lookup table, forms, child & parent relationships for attributes, etc. It behaves more or less like the Project Documentation Wizard from Desktop, with the huge difference that you can actually run all sorts of analysis on the Excel files generated by Metadata Browser, and you simply can’t do it with the HTML files generated by Desktop.
- Another upgrade that you requested is the LDAP and NT authentication modes. They are now available at login.
- Talking about the connection window, Metadata Browser is now capable of reading the most recent username that you have used for a certain project, from the registry. This will make it easier for you to login.
Enjoy!