Category Archives: Development

Using URL SDK to drill or hyperlink in Document

This is one of the requirement that I had sized quite some time back, and luckily I got go-ahead to implement it. My current client has process under which each projects goes, need less to say, time consuming. When business user say that they want drilling to be standardized, I feel a bit awkward. Most of the business users from my current clients have been trained by MicroStrategy, Inc. itself. 😐 First, these guys must know the difference between drilling and hyperlinking. Drilling is a feature of MicroStrategy, which comes OOB where as hyperlinking is something done by MicroStrategy developer, by actual link option for text fields (Similar to VB that we have been seeing for long) or using attributes having form of type html.

Now here is the requirement. Ex-vendor ripped the client big time by doing clumsy work. Thanks to them. :) They had created some enterprise dashboards that were having serialized hyperlinking. These hyperlinking were dependent on the name of project as well as the I-Server IP address. They just changed the name of MicroStrategy project and every URL went for toss. Now imagine, IP address/machine name of I-Server machine changing. This exercise would be repeated. I ran through 7-8 months old email regarding the same and found some leads, but were not working. Don’t know why, I myself had provided the solution to my peer. There are no (single) tech notes that would help me finding a solution, but I could find a solution by combining 2 tech notes, so relaxed.

Here is problem: Currently client has url SDK implemented as

http://abc.xyz.com/WebServer/servlet/mstrWeb?Project=<Project_Name>&Server=<IServer>&port=0&evt=4001&src=mstrWeb.report.4001&reportID=<Report_ID>&reportViewMode=1&src=mstrWeb

I can’t give exact example due to confidentiality but example above is very similar to actual, except that real one is about executing a document where as above one is about a report. Now, client want to remove the dependent on IP Address (We are providing removing the dependence as extra free addon, or may be we should generate more profit in future as that standardization is not part of the current scope of work) :D. Current URL is more complex and has two more not required events and corresponding arguments.

Now if tomorrow, any change of IP/machine name would make the work useless. The solution is simple. Simply remove the reference to them. The real magic of URL SDK lies in event and argument. You can read the function PDF that comes with installation of MicroStrategy. It talks about 4-5 event. A glimpse: You can create a link that will execute the report with particular attributes in page-by axis or Run reports/document with prompt answers.

In case of jumping from one prompted document to another, you need to pass messageID parameter that would forward the prompt to next document.

Only drawback of using URL SDK: Not a drawback, I would not recommend doing it. Using URL SDK you can also pass the login/apssword and create a hyperlinks that would work from a complete non-MicroStrategy page. Remember, I’m talking about the hyperlink not the resultant of hyperlinking. This puts your system in some disadvantageous situation.

“Outer Join” in MicroStrategy

During the past few weeks, I was confronted with many interesting tasks of the MicroStrategy world. And once again I had to annoy me about the fact that there is no clever way to MicroStrategy, an outer join between the attributes to be generated.

In Menu Data / Data Options / Calculations / attribute – join method can be adjusted, although, as the connection is to be made between the attributes, but these settings will lead to a difficult to understand SQL, the unexpected also depending on the situation to a conclusion can lead (more) in one of the next post.

In addition to the modification of views, there is another common workaround, which is to create a dummy metric, which is defined for each combination of attributes.  This metric will be hidden in the OLAP area, or via formatting in the report. Example of such a metric would be a simple constant function Sum (0).

Such a dummy metrics produces the same result as if all the attributes of the template would be linked to a FULL OUTER JOIN.

But what if you want some attributes with a FULL OUTER JOIN, and then connect the other with LEFT OUTER JOIN?  A simple idea would be to modify the metric by means of dimensionality, namely, the LEFT OUTER JOIN attributes with the setting ignore add / None.

Great idea, but does not work!  From a no apparent reason, no metric dimensioned in MicroStrategy can be “conducting”, ie standing in a LEFT OUTER JOIN on the left side. Too bad!

The original article in German language can be read here.

Using a transformation to calculate 5 last values within one SQL query

Here is one of my recent interesting tasks:

Calculate some metrics only for the items that are in high demand. An item is “in high demand”, if its sales value were greater than the constant X in every of the last 5 months (including the current month).

Solution

First again setting of tasks:

An article A is valid in the month M as an article with large demand, if its Abverkäufe in everyone of the last 5 months (inclusive the current month) were larger a fixed constant X (e.g. was X = 100). We want to find and in a report represent as efficiently as possible all to such combination A and M (which we if necessary than a Metric filter to use later to be able).

Here my solution is using only one transformation. I see the advantage of this solution in the fact that only once the generally very large fact table one accesses.

For all examples I will use according to standard installed the project in my blog MicroStrategy Tutorial. Therefore you can my examples easily copy and try out. In addition it is possible to compare several solutions of a problem directly.

As I already betrayed, I use a transformation in my solution. Therefore a Transformations view must be defined as the first. The data source for the project „MicroStrategy Tutorial “is an ACCESS data base TUTORIAL_DATA_7200.mdb.

We put on the following View:

SELECT t1.MONTH_ID, t2.MONTH_ID AS PREV_MONTH_ID, DateDiff („m “, t2.MONTH_DATE, t1.MONTH_DATE) AS MONTH_DIFF
FROM LU_MONTH AS T1, LU_MONTH AS t2
WHERE (((DateDiff („m “, t2.MONTH_DATE, t1.MONTH_DATE)) Between 0 and 4))
ORDER BY t1.MONTH_ID, t2.MONTH_ID;

The VB-function DateDiff supplies here the number of full months, which lie between the handed over date values. The expenditure of the View looks then about in such a way:

Image 1

We designate the View „MONTH_TO_5_LAST_MONTHS “. Now the View in the Warehouse catalog is imported; subsequently, on the new logical table the following objects are defined:

Transformation “5 load Months “

Image 2

Attribute “Months Diff “

Month Diff

Month Diff

In addition the attribute form Month@ID should be extended automatically to the field MONTH_ID the new table:

Month@ID

Now we want to build a Metrik, which „a bit-map with 5 digits represents “to the form *****. Each asterisk corresponds thereby one month: the linkste asterisk refers to the month in the regarded report line, the next asterisk to the previous month (relative to the regarded report line), etc.

In place of each asterisk we want to indicate the indication „to X “, if the Abverkaufswert of the article were larger in the regarded report line in that asterisk position corresponding month 100. Otherwise we indicate in place of the asterisk the indication to O.

If thus for an article in the month the bit-map is indicated to 200804 „OXXOO , that means that this article had the Abverkaufswerte only in the months 200803 and 200802 more largely 100. According to the definition from setting of tasks such an article would not have large demand in the month 200804. “Only the combinations of the articles and months correspond to the large demand, for which the bit-map is calculated.

And here the definition of the Metriks is bit-map Sales > 100 in The load 5 Months:

Metric condition

The dimensionality and Konditionalität of the Metrik are not changed. Only the transformation „5 load Months “is assigned the Metrik.

The formula of the Metrik looks as follows:

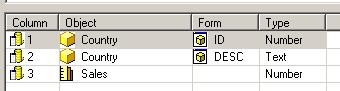
ApplyAgg(„max(iif((#0 = 0 and #1 > 100), ‘X’, ‘O’)) & max(iif((#0 = 1 and #1 > 100), ‘X’, ‘O’)) &max(iif((#0 = 2 and #1 > 100), ‘X’, ‘O’)) & max(iif((#0 = 3 and #1 > 100), ‘X’, ‘O’)) & max(iif((#0 = 4 and #1 > 100), ‘X’, ‘O’))“; [Months Diff]@ID; [Units Sold])

Because of the function ApplyAgg one must enter the logic in VisualBasic syntax (iif for the konditionale examination and & for the Konkatenierung). Probably it would function however also without ApplyAgg function, with the MicroStrategy functions IF and Concat. Logical way should generate however MicroStrategy in this case a very similar Query.

Here is screen SHOT of a report, which uses the Metric bit-map Sales > 100 in The load 5 Months :

Final Report

The original article in German language can be read here.

FreeForm SQL Reports

A while ago I had the opportunity to prepare a short training on the FreeForm SQL reports for some of my colleagues. I thought I’d better share this with you as well, so… here is a not-at-all-exhaustive list of things worth knowing about this type of report.

What is a FF SQL?

FreeForm SQL (aka FreeStyle SQL) is a type of report which allows the designer to define its own SQL code. Notice this is a rather different approach than what we are normally used to in MicroStrategy, where we would usually let the SQL Engine do the job.

When should it be used?

1. Whenever you tried everything (VLDB properties, Metric Levels, Attribute Relationships, Table Logical Size, Data Model changes…) and the SQL Engine still doesn’t perform that join the way you want it to.

2. Whenever you want to use a data source which does not exist in the Warehouse Catalog. That’s right, with FF SQL you can use almost any data source, including those tables you see in the left hand side of the Catalog.

How do I recognize it?

You don’t, at least not from the outside. You can either edit a report and see if you can spot the unnoticeable “Freeform SQL Definition” button, or you can right click on the report and make a component search. If it has no components, you found it.

So, unless you set up some naming convention for FF SQL reports you will very soon lose track of them.

How is it created?

Click on “New -> Report” and select “Freeform SQL” from the list (you need a special role to see this option).

Type your code in the upper right hand side frame.

Now you have to map the items from the “Select” section of your script to virtual Attributes and Metrics. To do this, right click on the lower frame and select either “Add new Attribute form” or “Add new Metric”.

For a script like “SELECT country_id, country_name, SUM(sales)…” the mapping should be defined as:

FF SQL

These are virtual objects. You may actually have a “Country” Attribute in your project, but please don’t make the mistake of thinking these two are the same thing.

Click OK and you are back on familiar grounds.

Prompts in FF SQL

You can either create or insert them into a WHERE clause, by using the two dedicated buttons. The Prompts will show in bold pink.

Now, here is the interesting part. Let’s say you want to make some changes to the script, and you copy it into an external editor. You will notice that the prompts were converted into object IDs. Now, paste the text back into the FF SQL editor. They are bold pink again. Too bad the report won’t work anymore…

The prompts will have to be inserted again, the “button” way, if you want the report to run properly.

Words of caution.

Being what I call a “manually defined object”, the FF SQL is not subjected to automatic Schema updates. That is to say, you won’t be warned if you delete a table which is being used by such a report. So please bear in mind that maintenance for FF SQL can be harsh.