MicroStrategy 9.0 Hotfix 1 goes GA

MicroStrategy 9.0 Hotfix 1 is now generally available (GA) on the MicroStrategy Download Site.

Defects and Enhancements addressed in MicroStrategy 9.0 Product Suite can be found in the ReadMe.

But…

I’m wondering: Why this HotFix was released too close from the 9.0 launch?

Well…

A HotFix is a FIX! Therefore the 9.0 version was released with a number of bugs that had required this fast paced HotFix.

Question:

May I stay with my 8.x version or upgrade to 9.0?

Look close to MSTR 9.0 improvements and ask yourself if you need this upgrade. If no, then stay calm and wait for a second hotfix.

Bye

Spool space error

Okay, so this is an old one, but I still find it useful.

If you can’t run a report because of a spool space error, and you can’t convince the DBA to give you a couple of gigabytes more, then you might want to go to the Report Editor, Data ->VLDB Properties -> Tables -> Intermediate Table Type and select True temporary table.

What this does is modifying the SQL so that instead of having a huge chunk of code (that would use up a lot of memory) it breaks the code into CREATE – INSERT bits that are far easier to handle. It also makes the SQL more readable by humans (this includes programmers).

By the way, this setting also comes to rescue when you get the “Database is terrified by the script and it can’t even begin to analyze it” error. I don’t have the specific error message at hand, but I know for sure that Teradata does this when the SQL code is all in one pass and is so large that it can be seen from the Moon.

Cold response to free MicroStrategy Reporting Suite

I’ve recived a confirned news about the lukewarm response to the free MicroStrategy Reporting Suite and MicroStrategy, Inc is getting desperate for License revenue. This is forced them to re-launch the free Reporting Suite. They have hired a battary of paid news sites, which is obvious with all BI product vendors. But the lukewarm response has forced them to relaunce the free suite once again after the initial launch. BTW, the price of v9 is strangely not much.

Logical views with MicroStrategy

Business intelligence architects have always relied on the Datawarehouse team to create database views or perform datawarehouse changes in order to construct the BI architecture.   If something was not architected as desired, then the BI developers were forced to request these changes, and then wait for their completion before moving forward.   Since MicroStrategy 8, BI developers have had the ability to create logical tables and table aliases to circumvent this process.  This article will go through various examples on how this can be used on an implementation.

Lookup Tables and Reuse of Dimensions – The most obvious reason for requiring logical tables or aliases is for the creation of lookup tables or reuse of dimension tables.   First off, the difference between an alias and a logical table is that an alias is an exact copy of a dimension table, and if the dimension table or alias changes then both will change.   The logical table on the other hand is a custom SQL statement that utilizes any table available to the BI developer.    Lets say we have a fact table F_FACT, that stores 3 products per transaction, but the data model only has one D_PRODUCT table.    Aliasing allows us to alias D_PRODUCT into D_PRODUCT_1, D_PRODUCT_2, and D_PRODUCT_3, so that we now have 3 separate tables to join to F_FACT.   Now, lets say that the 1st product is a laptop, the 2nd product is a battery, and the 3rd product is an AC Adapter.  We could still join F_FACT to the 3 aliased product dims, but we also want only laptops to show up in D_PRODUCT_1, only batteries in D_PRODUCT_2, and only AC Adapters in D_PRODUCT_3.   This is where logical tables can come in to play.   First, lets create a logical table called D_PRODUCT_LAPTOPS which we create with the following SQL statement, ‘SELECT * from D_PRODUCT where PRODUCT_TYPE = “LAPTOP” ‘.    Quite simply, we have created our own dimension table of laptop products without additional support from the EDW team.

Case Study:  Using Logical Views to make a Fact table from a Dimension – Lets say we have a dimension table called D_EMPLOYEE with the fields employee_key, employee_id, employee_name, record_start_date, record_end_date, employee_start_date, employee_end_date, and organization.

fig51a

Now, lets say we want to be able to count Active and Terminated employees from a fact.  Our first problem is that D_EMPLOYEE is a type 2 dimension, so we need to pull only the latest record on this dimension.   For the metric, we have the option of building the count of active and terminated employees either on the fact table or by building a fact object in MicroStrategy.  For this demonstration, we will build the counts on the fact itself.

In order to pull the latest record from D_EMPLOYEE, we will use the following WHERE condition: WHERE RECORD_END_DATE = ‘12/31/9999′ or RECORD_END_DATE = EMPLOYEE_END_DATE which will pull the latest record for each employee.

For the facts, we will add the following fields to the SELECT part of the query: CASE WHEN RECORD_END_DATE = ‘12/31/9999′  THEN  1 ELSE 0 END as ACTIVE AND  CASE WHEN EMPLOYEE_END_DATE is not null THEN  1 ELSE 0 END as TERMINATED.

The Final Logical table will look as follows, and now we have a new fact table.

fig52a

Case Study:  The POOL technique – Once you start to use Logical table , you will start to see that this can be a very powerful tool that can accomplish a great deal, as long as performance allows it.   Please note that these table Views just serve as queries on the database, and are not materialized in anyway.   What I often do after creating a complicated logical view is run it through a query tool like Toad.   If it does not return results immediately, then I send the query off to our DBA to see what they can do.

The POOL technique (which I’ve named it) is actually a technique for developing complex SQL reports when there are no data warehouses or BI Tools.  The point here is that you can use this technique to develop a complex piece of SQL, and then use that SQL in a MicroStrategy logical view, so you can build metrics and attributes on top of that SQL.   This technique is also great for developing Freefrom SQL queries in MicroStrategy.

The concept is simple.  First develop a query that gets you as far as you can with the base tables, and then use that query as the base table for a new query.   Repeat until you have what you need.  One other point is to try to avoid Sub Selects as much as possible because they can seriously slow down performance.

Lets use the table D_EMPLOYEE above and the logical view F_EMPLOYEE as our basis.  The report we want to create is a list of active employees, their current organization, and the number of organizations they’ve been in.  If the number of organizations is greater than 5 then we want to mark this record as a MOVER.

First, we build SQL to get as far as we can.  I don’t put the number of Organizations in this query for illustrative purposes, but do you see how to calculate number of Organizations in this query without a sub Select?

fig53

Next we use the statement just created as the base table for the next select, and name this base table POOL.  We then create a query based on POOL which now calculates the Number of Organizations.
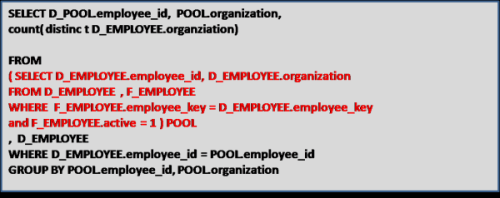
fig54

Now we use the SQL statement above for our base table, and call that table POOL2.   We do this to add the MOVER field to the report.
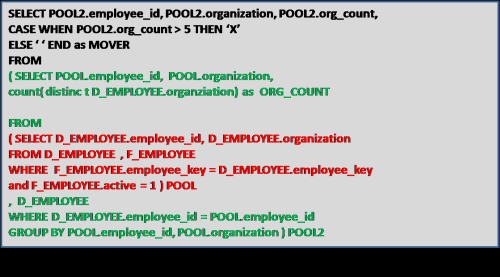
fig55

We can keep going if we had more complex requirements, but the point is that this technique can be used to develop complex queries, which we can then plop into a MicroStrategy logical tables.   Maybe we will create an attribute called MOVER?   The options are now far greater with logical tables.

Customizing Narrowcast XSL

In Narrowcast Server, when you use report in EXCEL document, instead of normal report output; you can customize the output result based on your own design by modifying default Narrowcast XSLT.

In order to design Narrowcast XSLT, first we need to understand the Report XML and its content present in XML file.

How to get the get the report xml:

  1. Run the corresponding report in the WEB.
  2. In the Address Bar, enter ‘&XML=1’ at the end of the URL as shown below.
  3. Right click in Browser and Select the ‘ViewSource’ option.
  4. Search for ‘<mi’ in the Source and starting from the ‘<mi’ tag copy till end tag (i.e) ‘mi>’.
  5. Paste the copied text in notepad and save it in ‘.xml’ file.

Note: Report data Tag starts with <RH>

Narrowcast XSLT’s and Tags specific to spreadsheet

Note: All aspects of this XML specification, including element (tag) names, attribute names, and attribute values are case sensitive. •

  • The pt-container is the root level of every Excel XML document element that contains the table tag. This tag is required.
  • The table tag contains both content and formatting tags for turning data into a well-formatted grid. The resulting grid overwrites a contiguous rectangle of cells in an Excel workbook when an Excel document is rendered. An Excel XML document element can contain only one table tag.
  • The fonts tag contains the set font definitions that control the font characteristics of cells written into the Excel workbook. Font definitions include font type, color, size, weight, and modifiers like italic. An Excel XML document element can contain only one fonts tag.
  • The font tag contains the definition of a specific font used for this document element. Zero or more font tags are required.
  • The styles tag contains the set style definitions that control cell formatting for cells written into the Excel workbook. Style definitions include all font characteristics as well as background color, orientation, alignment, and borders. An Excel XML document element can contain only one styles tag.
  • The style tag contains the definition of a specific style that is used for this document element. Zero or more style tags are required.
  • The formats tag contains the set of format strings that are used to format date, time, and numeric cell contents. An Excel XML document element can contain only one formats tag.
  • The format tag contains the definition of a specific format string that is used for this document element. Zero or more format tags are required.
  • Each row in a table contains cells. A blank row can be represented by the inclusion of a row containing an empty cell. One or more row tags are required.
  • Each cell in a row contains the data that should be placed into the corresponding cell in the resulting grid. One or more cell tags are required.

Sample Report output and used to design the XSL

Country Region Revenue
USA Northeast

$2,334,864

Mid-Atlantic

$3,413,340

Southeast

$2,016,186

Central

$1,773,270

South

$1,380,991

Northwest

$1,485,182

Southwest

$2,816,334

Web Web

$1,716,267

Sample XSL created for the above Report (you can take default Narrowcast XSL and Modify the content except parent tags)

[sourcecode language=”xml”]
<?xml version="1.0"?>;
<xsl:stylesheet version="1.0" xmlns:xsl="http://www.w3.org/1999/XSL/Transform">;
<xsl:output method="xml" omit-xml-declaration="yes" indent="yes" />;
<xsl:template match="/">;

<pt-container>;

<table row-count="3" column-count="12">;

<fonts>;
<font name="ObjectName1" family="Arial" size="10" weight="bold" style="italic" />;
<font name="ObjectName2" family="Arial" size="10" weight="bold" style="italic" />;
<font name="ObjectName3" family="Arial" size="10" weight="bold" style="italic" />;
<font name="ObjectValue1" family="Coronet" size="11" weight="bold" color="12" />;
<font name="ObjectValue2" family="Coronet" size="11" weight="bold" color="12" />;
<font name="ObjectValue3" family="Coronet" size="11" weight="bold" color="12" />;
</fonts>;

<styles>;
<style name="SObjectName1" background-color="47" align="center" border-top="style:medium" border-right="style:medium" border-left="style:medium" border-bottom="style:medium" font="ObjectName1" />;
<style name="SObjectName2" background-color="44" align="center" border-top="style:medium" border-right="style:medium" border-left="style:medium" border-bottom="style:medium" font="ObjectName2" />;
<style name="SObjectName3" background-color="34" align="center" border-top="style:medium" border-right="style:medium" border-left="style:medium" border-bottom="style:medium" font="ObjectName3" />;
<style name="SObjectValue1" background-color="47" align="center" border-top="style:medium" border-right="style:medium" border-left="style:medium" border-bottom="style:medium" font="ObjectValue1" />;
<style name="SObjectValue2" background-color="44" align="center" border-top="style:medium" border-right="style:medium" border-left="style:medium" border-bottom="style:medium" font="ObjectValue2" />;
<style name="SObjectValue3" background-color="34" align="center" border-top="style:medium" border-right="style:medium" border-left="style:medium" border-bottom="style:medium" font="ObjectValue3" />;
</styles>;

<formats/>;
<row>;
<cell style="SObjectName2" type="8">;Region</cell>;
<xsl:for-each select="/mi/rit/vw/gr/rh/rw">;
<xsl:if test="./h[1][@rfd=’4′]“>;
<cell style="SObjectValue2">;<xsl:value-of select="./h[2]/fv"/>;</cell>;
</xsl:if>;
<xsl:if test="./h[1][@rfd!=’4′]“>;
<cell style="SObjectValue2">;<xsl:value-of select="./h[1]/fv"/>;</cell>;
</xsl:if>;
</xsl:for-each>;
</row>;

<row>;
<cell style="SObjectName3" type="8">;Revenue</cell>;
<xsl:for-each select="/mi/rit/vw/gr/rh/rw">;
<xsl:if test="./h[1][@rfd=’4′]“>;
<cell style="SObjectValue3">;<xsl:value-of select="./mv"/>;</cell>;
</xsl:if>;
<xsl:if test="./h[1][@rfd!=’4′]“>;
<cell style="SObjectValue3">;<xsl:value-of select="./mv"/>;</cell>;
</xsl:if>;
</xsl:for-each>;
</row>;

</table>;

</pt-container>;
</xsl:template>;
</xsl:stylesheet>;
[/sourcecode]

Output for the above Report along with the XSL

1) Save the above XSLT

2) Insert the XSLT as XSL file in Narrowcast Server

3) In the documents, while mapping report in EXCEL document; Map this XSLT for the particular report

4) complete the service (as we do normally)

5) Run the service, you will get the customized output

Narrowcast XLST output

Narrowcast XLST output